|
The SQLBeat Database Monitoring Framework is itself SQL Server based, and its monitoring modules are driven by SQL jobs. There are no agents or software of any kind to install on the servers being monitored - SQLBeat guarantees a minimal footprint. SQLBeat's monitoring generates datamarts which populate dashboards built in ASP.net - in addition, these datamart databases are open directly to you for Management Studio access for custom query development, dashboarding and reports.
|
|
SQLBeat's Architecture
SQLBeat has a core platform, to which modules are added to provide additional monitoring and reporting functionality. All modules run on the same server, are configured through the same user interface, and are agent-less and open-source. SQLBeat's Core Module contains the following basic components:
Databases |
Separate databases are responsible for overall coordination, tracking and aggregating Alerts, Performance History, Activity History, Security and Configuration data. Time-partitioned datamarts are automatically created to maintain historical data. |
Agents |
Individual agents communicate independently with SQL Server and with server hardware, controlled by SQL jobs. Queues manage multi-environment installations, so that many sets of servers can be monitored in parallel. |
Alert Engine |
A central Alert Engine manages processing and delivery of all outbound messages. The alert engine is rules-based and allows for easy recipient configuration – including time of day, group and message text filtering. |
Dashboards and Reports |
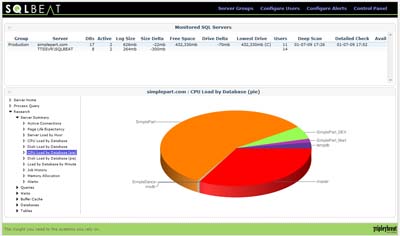
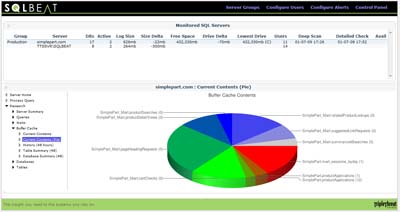
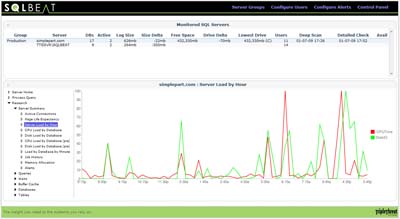
SQLBeat's built-in Dashboards provide a view into Enterprise and SQL Server performance and configuration, as well as the tools necessary to drill into tuning and troubleshooting problems. |
|
|
SQLBeat Monitored Metrics and Data Warehouse
SQLBeat's unified data warehouse maintains a comprehensive record of all measures recorded. This data warehouse is automatically time-partitioned, and managed as a part of SQLBeat's core functionality. This data warehouse is suitable for change auditing, performance tuning, event research, long term planning and to facilitate centralized management of Enterprise environments spread over many servers. Each monitoring module maintains a working database, as well as time-partitioned monthly datamart databases with day and week tables.
|
|
SQLBeat Core
-
SQL Server Monitoring
SQLBeat's Database Monitoring framework is focused on automating the regular checks and maintenance that keep high-transaction multi-server environments running smoothly. In SQL Server 2008, SQL Server 2005 and SQL Server 2000, SQLBeat compiles and analyzes performance statistics in real-time, to provide instant access to tune and troubleshoot performance at the query, connection and server level. A complete performance history is maintained in local time-partitioned datamarts for reporting and query.
SQLBeat also performs regular database integrity checks and table fragmentation scans, reports the results by email – and can even repair many minor issues. Further, SQLBeat monitors network connectivity to all servers and records a complete history of any interruptions.
-
SQL Server Performance Tuning
SQLBeat's comprehensive archive of server performance and activity information is available through intuitive dashboards to help guide performance tuning – from index activity to CPU and Disk queues, SQLBeat has it covered. SQLBeat's real-time alerts also help you proactively intercept performance problems and avoid end-user impact.
-
Security, Auditing and Change Management
SQLBeat simplifies database security management, tracking object changes and rights at the Network, Server, and SQL level. SQLBeat monitors all SQL objects and generates email alerts when changes are detected; archives of user activity provide a clear, documented audit trail for all actions.
-
Disaster Recovery Monitoring
SQLBeat 's integrated monitoring for Replication and Log Shipping delivers realtime alerts and out-of-synch monitoring for your standby servers. SQLBeat will also watch record counts in key tables that you define across servers, and alert when these counts do not match - as an added check to guarantee data integrity for your critical systems.
-
Realtime Email Alerts and Dashboards
The SQLBeat Framework includes built in alerts, triggered at user-defined thresholds that are delivered in real time and archived for reporting in local datamarts. These alerts cover all aspects of Database and Server level performance, connectivity, security and configuration. SQLBeat's integrated time-partitioned datamarts provide the back-end for web-based dashboards (included with SQLBeat ), as well as your custom queries.
|
|
|
|
|
Windows Event Log Monitoring
SQLBeat 's Event Log Monitor module watches the Windows Application and System event logs on an interval that you define. As entries in the logs are detected that meet defined rules, email alerts are generated and sent in real-time. All event log entries are recorded to the SQLBeat server, and are available for query. Verbose errors from hardware devices are typically generated from the Event Log monitor, as are Reboot notifications, overheats, SQL messaging and Application errors.
|
|
Installed Software Monitoring
SQLBeat can watch Servers and Workstations, using both WMI and file system executable scans. WMI is used to connect to the Windows Installer “Uninstall” list on each compliant machine to retrieve the declared list of friendly installed items. When entries on this list change, an email alert is generated. Granularity here includes build numbers, install date and patch revision.
File system executable scans can be scheduled to monitor installed items on “unfriendly” systems. This connects to remote file systems and scans directories for a configurable file mask. When entries differ between subsequent runs, an email alert is generated.
From both scan methods, a catalog of installed software across the enterprise is available as a report from the Dashboard and for query.
|
|
Customizable WMI Monitoring
SQLBeat's WMI Monitoring module allows for any accessible WMI counter to be monitored. Collected information is automatically aggregated and rolled into monthly datamarts, for easy query. Hooks are in place to allow you to integrate business processes which need to react to changes in WMI counter values.
WMI-acessible counters can include information about CPU and Disk performance, as well as a host of OS and hardware-level measures. Many hardware and software vendors also expose WMI-accessible counters to allow outside performance monitoring, all of which SQLBeat can read.
|
|
IIS Weblog Monitoring
- Realtime access to IIS weblogs
- A comprehensive data warehouse, built around your weblogs
- Reports and analytical tools which provide you clear visibility into your web traffic
|
|
URL Monitoring
- Monitor any number of URLs
- Validate that expected text is present
- Record and report against time-to-load
|
|
Remote Monitoring Services
As a component of your SQLBeat implementation, you may choose to subscribe to Remote Monitoring. Remote Monitoring integrates your SQLBeat with our Network Operations Center, who will monitor critical alerts and respond according to your outage response guidelines.
SQLBeat has two monitoring options: 24x7 monitoring and 5x8 monitoring. The 24x7 option ensures that your systems are monitored around the clock, 365 days a year. The 5x8 plan also monitors you systems 24x7, but our team only responds to critical issues during normal business hours. Our team will develop a comprehensive escalation plan with your system administrators. This includes categorizing severity levels for events and developing key contact points when issues arise. This option frees up your key personnel to concentrate on more strategic objectives. With SQLBeat monitoring, you will never again arrive at the office to be surprised by a system outage.
|
|